HOWTO
Index
Overview - How this works.
Anyone can view data that has been made public. Follow the prompts to retrieve results. Specific reagents can be included
as well as excluded from searches.
Multiple elements in search lists can be selected by Shift+click and Ctrl+click. We believe the functionality is self-evident,
but should this not prove to be the case, please - we'll answer your query and add it to our FAQ if it proves to be common.
In order to take advantage of the curation features of this site for your own work, you'll need to create an account. Instructions on how to complete each step and use this site follow below. The basics are these:
I. Create an account - Ultimately this allows you to upload images of stained protein gels and files containing sample descriptions,
indicating which samples have been run on the gels. The images and sample descriptions are organized as "Experiments," which are associated with "Projects."
II. Create a Project - Projects are simply a way to organize your experiments. You must create a Project to add Experiments (images and sample descriptions) that will be associated with that Project. Multiple experiments can be added to any Project. Projects can also be created in any existing Project (i.e. as a sub-Project). Create multiple Projects to keep your different kinds of affinity capture experiments organized.
III. Upload Experiments - upload images of gels and tab-delimited text files that list the samples loaded on the gels as well as
some basic descriptive text. Our software will section the gel image into individual lanes according to the number of lanes
specified in the text file. The experimental conditions used to derive that sample, also specified in the text file, will be
linked to the lane. In this way, different lanes from different gels can be compared, with the conditions used to obtain the
results also displayed. All your data are kept Private to your account until you choose to share them Publicly.
IV. Retrieve results - You can catalog all of your purifications, and track the resulting banding patterns. You can also view any results that others have
made Public and compare them to your own.
As much as possible, we aim to implement Minimum Information Standards and
implement Ontologies and Controlled Vocabularies to maximize the value of experimental
data lodged in this repository.
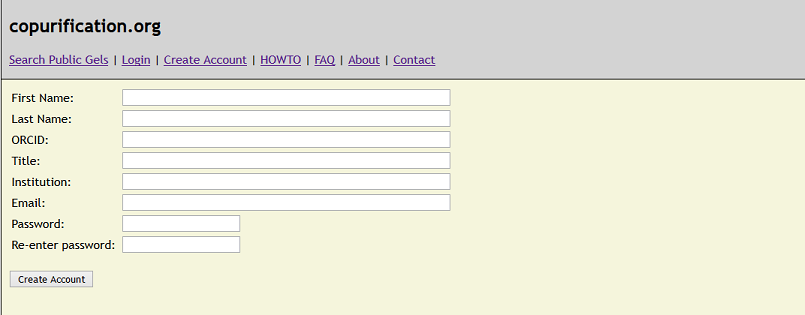
HOWTO - Create an account.
Follow the link "Create Account" and fill out the web form. We encourage users to create an ORCID and
associate this ID with their account. These unique IDs provide a mechanism for a researcher to remain associated with and credited for their data and
publications. Once logged in, your account details can be changed via the "My Account" link.
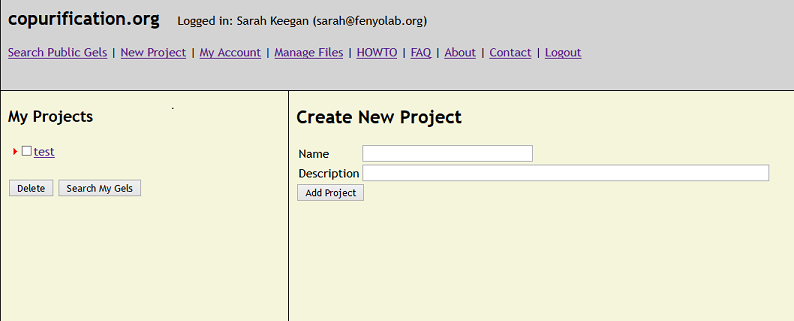
HOWTO - Start a new Project.
While logged into your account, a new project may be added by clicking the "New Project" link. Once created, the new project will appear on the left side
of the screen. Clicking on the project displays the "Create New Experiment" interface, where experimental details, including images of gels and the affinity
capture conditions used, can be added to the project. A New Project can also be added to an existing Project by clicking on the Project and filling out the
"Create New Project" interface.
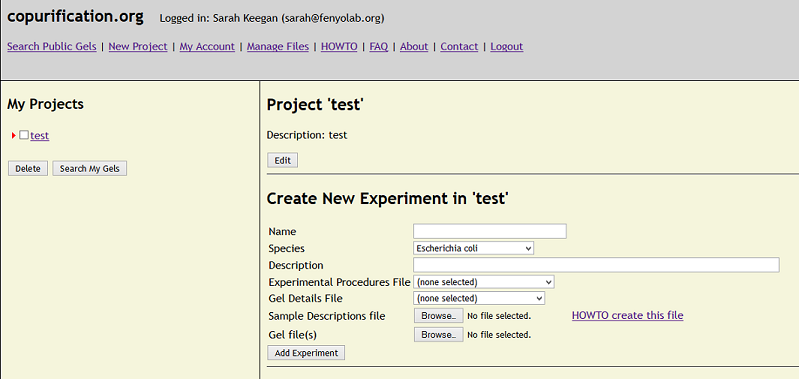
HOWTO - Add Experiments to a project.
Fill out the required fields, specifying the appropriate organism. "Experimental Procedures," a text file
describing the experiments and protocols, may be uploaded but is not currently required (the system will
accept TXT, RTF, and DOC files). A "Gel Details" file describing the conditions of the gel electrophoresis
and basics of image development and capture may also be added; although currently not required, for this we strongly recommend you supply an
MIAPE-GE compliant file (the system will accept TXT, RTF, DOC, and XML files).
Experiments must include both a "Sample Descriptions file," listing the purification conditions used in the affinity capture experiments, and the associated gel
image(s) showing the resulting banding patterns for each affinity captured sample. Currently, the Sample Descriptions file is a plain text file including
tab-delimited values. It must contain one line for each lane of the gel where a sample, marker, or quantity standard has been loaded. Each line contains
numerical and categorical data (format described below). Upload as many images as needed, all the lanes present in each image are described in the same Sample Descriptions file.
The images may be in TIFF, PNG, BMP, and JPEG format, but we recommend the use of 16-bit TIFF images. Please note that JPEG format images cannot be quantified
by our band-detection tool. Important - when cropping your gel photographs, be certain to crop as close to the perimeter of the gel as possible. We recommend just
inside the gel perimeter, otherwise, edge effects may inhibit accurate clustering / lane matching. Large empty areas at the top or bottom of the gel may also be cropped
away if problems in clustering / lane matching are observed, and may improve results.
Although our system will accommodate images in a variety of formats, resolutions, and bit-depths, we recommend the use of unprocessed, uncompressed images;
i.e. the original, raw data (e.g. as a 16-bit TIFF). Our system will apply brightness and contrast calibration during the curation process without altering
the original data . To get the best results from our lane-sectioning tool, gel images should be oriented such that the first lane (defined in the
Sample Descriptions file) is at the left, and the last lane is at the right, and that the gel is properly aligned
(see this example). For best results, image the gel in the appropriate orientation, initially. However, rotation and cropping of the gel image, when needed, can be carried out in an
image-processing program - we recommend saving the file in the same format as the original.
Our program is equipped to ignore empty lanes or otherwise omit lanes not described in the Sample Descriptions file. The total number of lanes in the image is defined in
the Sample Descriptions file (example below). The positions of the samples loaded on the gel (lane number) are also defined in the same file. Once the image is curated, the
gel image is divided into lanes based on the total number specified in the Sample Descriptions file, and the lanes containing sample are identified based on their numerical position
(counting from left to right), as specified in the Sample Descriptions file. The lane-sectioning tool uses the average lane width as a guide to section empty lanes. Lanes
not described in the Sample Descriptions file are treated as empty and ignored Do not include rows for empty lanes in the Sample descriptions file because certain descriptive
columns are mandatory for all lanes in the file and will cause an error if not completed.
Example: You've run four, twenty-six-well midi-gels. Each gel contains one molecular weight marker, one BSA quantity standard and twenty-four
experimental samples - for a total of one hundred and four samples across four gels. You will need one Sample Descriptions
file listing all one hundred and four samples loaded across all four gels (see this example, and HOWTO below ) and four image files (one of each gel). Note: the names of the image
files MUST match the "Gel file name" specified in the Sample Descriptions file - this is how our program knows which sample descriptions go with which gel and which lanes
on that gel.
Please Note: the above links to examples of the Sample Descriptions file are for illustrative purposes, but do not contain all required columns in our newest format.
Please refer to the instructions directly below for a full description of all required columns.
HOWTO - Fill the Fields of the Sample Descriptions file.
The Sample Descriptions file can be filled out as a spreadsheet in any program that can
save the result as a tab-delimited text file,
such as MS Excel. The function of this file is to provide information about the samples loaded on the gel, such as the composition of the
extraction solvent used, the protein of interest (bait), the affinity tag (if any), the antibody used for capture, and so on. Many of the
short comings of the current system will vanish once we switch to an XML format - and once we have had the chance to implement ontology and
controlled vocabulary. Please for questions or doubts. We encourage adding references to certain fields as PMID, PMCID or
DOI when helpful, as discussed below.
When describing the extraction solvent(s) used, multiple reagents of the same class (most commonly salts and detergents) can be specified by adding the appropriate
headings multiple times (e.g. salt, salt concentration, salt unit for each different salt used). Note: we currently accept the following units of metric
concentration - M, mM, uM, μM, nM, pM. Note, micromolar units can use either a 'u' or a Greek letter mu as the prefix. We also accept concentrations expressed
as percent volume units: % w/v and % v/v (however, we are not currently processing % w:v, % v:v or any units expressed as percent weight).
Here is a full list of all the reagents currently supported by our system.
if you need to have a reagent added to this list for your upload to work. In most cases an example of common usage can be gleaned by viewing the public data and the
example Sample Descriptions file.
- The following fields are mandatory for each lane: Gel file name, Lane # on gel, and Total # of lanes on gel.
- The following fields are mandatory for each lane EXCEPT those specifying a Mass Ladder or Quantity Standard: Over-expressed,
Protein Systematic Name, either Antibody or Other capture and Single Reagent Flag.
- Each gel must have at least one lane with an associated Mass Ladder column. Quantity Std is optional for a gel, and
will be ignored if a JPEG file is submitted.
- All fields permit 255 characters, except for notes, which permits 500 characters.
These are the metadata contained within the file:
Gel file name: specifies which image the entry applies to. The value entered here must match the file name of the gel image.
Lane # on gel: specifies the position of the sample on the gel by lane number, from left to right.
Total # of lanes on gel: specifies the total number of lanes.
Buffer: specifies the agent primarily responsible for pH control of the extraction solvent.
Buffer Concentration: the magnitude of the concentration.
Buffer Units: the units of the concentration.
Salt, Detergent and 'Other' additives follow the same convention as for Buffer. Other additives are commonly those that don't readily
classify as, or whose indented function in the solvent is distinct from, a buffering agent, salt or detergent (e.g. EDTA or urea).
pH: specifies the pH of the extraction solvent
Mass Ladder: specifies the molecular masses, in kDa, of the bands present in the molecular weight marker; each mass is separated by a comma.
Quantity Std: specifies the identity, molecular mass in kDa, quantity loaded, and quantity units of a standard protein; each entry is separated by a
comma. E.g. BSA, 66.5, 100, ng specifies that 100ng of BSA was loaded and that BSA is a protein of 66.5 kDa molecular mass.
Over-expressed: specifies if the bait protein is over-expressed in the sample or not. As a rule of thumb, we believe that an expression level
of more than double the wild-type (wt) expression level could be considered over-expressed. Amongst other things, knowing if the bait is over-expressed
assists in assessing the significance of the levels of the other co-purified proteins relative to the bait. Acceptable values for this field are yes, no, & unknown.
Protein Systematic Name: specifies the identity of the bait protein. We currently curate:
- Escherichia coli genes and proteins - specified by GenBank accession numbers
- Homo sapiens genes and proteins - specified by GenBank accession numbers
- Mus Musculus genes - specified by Mouse Genome Informatics (MGI) gene IDs
- Saccharomyces cerevisiae - specified by Saccharomyces Genome Database (SGD) systematic names
We encourage the use of RefSeq accession numbers whenever appropriate for your bait sequence. In some cases the bait protein may
be present in multiple isoforms, or the isoform expressed may not be specifically defined - such as when the expression construct
is not based on cDNA, but rather on e.g. gDNA containing intronic sequences and introducing the possibility of alternative splicing.
LAP-tagged genes expressed via BAC TransgeneOmics (DOI: 10.1038/nmeth.1199) present such a case. The genomic locus of the protein of
interest is tagged and reintroduced, and the precise tagged protein expressed will depend on the cell type and may not be uniform.
In this or similar cases, where the precise protein product is less well defined, we encourage the use of GenBank Gene ID.
Additionally, in many cases the bait may be mutated or truncated by design. Where an SGD or GenBank record does not exist to
define the sequence utilized, use the sequence ID that most closely matches the expression construct and append additional info
in the Notes column to communicate the alterations. to add your organism to our database or for cases where you
encounter difficulties assigning an appropriate ID to your bait.
Helpful links:
http://www.yeastgenome.org
http://www.ncbi.nlm.nih.gov/protein
http://www.ncbi.nlm.nih.gov/gene
http://www.ncbi.nlm.nih.gov/refseq
Tag Type: if the bait is captured through an affinity tag, this entry provides for the tag to be specified. Please enter the name of the tag and any additional info,
especially references (as PMID, PMCID or DOI), in parentheses. Some common tags include: LAP, GFP, FLAG, 3xFLAG, Myc,
SpA (based on wt Protein A), TAP, ZZ (tandem synthetic Protein-A-based Z-domains), 3xHIS (and various other multiple), etc. and so on.
Tag Location: if the bait is tagged, this specifies where. Acceptable answers are N-term, C-term, and Internal. Required if Tag Type is specified.
Antibody: specifies the antibody reagent used to capture the bait protein, either directly or through an appended affinity tag. Provide a short description of the reagent - such
as Rabbit IgG (which might be use for purifying a Protein-A-tagged protein) or polyclonal llama anti-GFP, or anti-FLAG M2. In parentheses please provide a manufacturer and
product number if purchased commercially, and or an appropriate reference for the reagent.
Other Capture: if the affinity reagent used was not an antibody, or if multiple affinity steps were utilized (e.g. including a second reagent, antibody or not, such as in tandem
affinity purification), then the reagent used may be specified here. Follow the conventions used above.
Notes: in this section any additional details important for understanding the affinity capture may be provided. Please be judicious and succinct. Examples of info to provide might
include details of the construct or expression system, capture method, etc. References are always encouraged.
Single Reagent Flag: this field is intended to indicate whether the entire protein purification experiment was conducted using the same solution or ‘buffer;’
i.e. a single purification reagent solution. If e.g. the results in lane #2 were obtained using a solution of 20 mM HEPES pH 7.4, 200 mM NaCl, and 0.01% v/v Tween 20
for making the cell extract and washing the affinity resin up to the point of elution, indicate ‘yes’ in this field for lane #2.
If more than one distinctive solution was used for extraction and washing prior to the final elution, then answer ‘no’ in this field. In the case that multiple, distinctive
solutions were used to extract and wash a sample, then we suggest listing further details of the solutions used after extraction in the Notes section. See FAQ.
Elution Method: ideally, elution is achieved by thorough denaturation in e.g. 2% (w/v) SDS, or natively by e.g. competitive displacement or protease cleavage in the same buffer
used for extraction and washing. In this field, specify “denaturing” if a solution was used that effectively disrupted the interaction of the target with the affinity medium,
releasing the affinity captured complexes without the aid of a competing epitope or enzymatic reaction; “native” should be specified if e.g. competitive displacement (peptide elution)
or protease cleavage was used to release the affinity captured complexes. See FAQ.
Elution Reagent: specify the composition of the elution solution. If a peptide or enzyme was used, please provide its effective concentration and the identity of the reagent.
In parentheses, provide a manufacturer and product number if purchased commercially, and/or an appropriate reference for the reagent. If the native elution reagent was used in a solution
different from that used for protein extraction and washing, please provide the solution ingredients in brackets. See FAQ.
An example entry for a native, 3xFLAG peptide elution in a different solution than was used to extract and wash the affinity captured complexes:
1 mg/ml 3xFLAG peptide (Millipore Sigma F4799)
[20 mM Tris pH 8.5, 300 mM NaCl, 0.1% v/v Tween 20]
An example entry for a denaturing, LDS-based elution in a commercially available sample loading buffer:
1.1x NuPAGE LDS sample buffer (Thermo Fisher Scientific NP0007)
HOWTO - Add Protein and Mass Spectrometry Data to Experiments
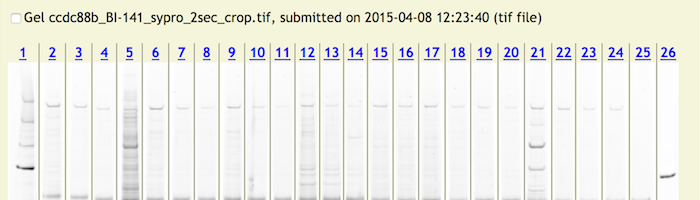
Once an experiment has been added to a project, mass spectrometry data may be added to the lanes and individual bands. To start – expand a project or subproject by clicking on
the “checkbox” (the arrow which will be red it there are experiments to view) in the My Projects display list on the left of the web page. Clicking on an experiment will display
one or more gels to the right side of the web page. Each of these gels will have the separate photographs for each of the lanes. The lane numbers at the top are clickable and so
are the bands within each of the lane photographs.
To Add Protein/MS Data to A Lane
Clicking on a lane number will display a pop up window for entering mass spectrometry data for the entire lane.
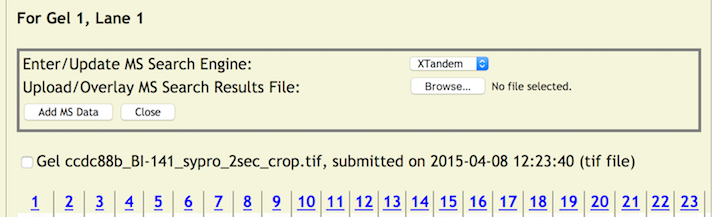
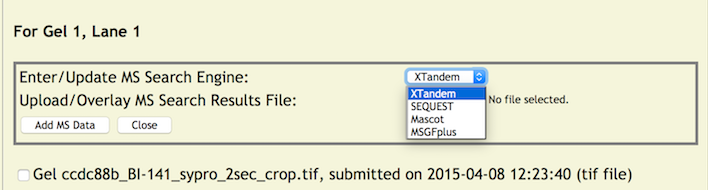
First, choose one of the search engines from the pull down menu.
Next, click the file browse button to choose a MS Search Results file from your server or local machine to upload to the copurification web server (it will be the standard file selection window for your browser). When ready click the [Add MS Data] button which will start the uploading of the file and update the database with the MS Search Engine. Once completed the page returns to its initial view. However, the color of lane number will change from blue to green indicating that lane information has been applied. In addition, when the mouse is rolled over the lane number link (now green) will reveal some updated information – the MS Search Engine.
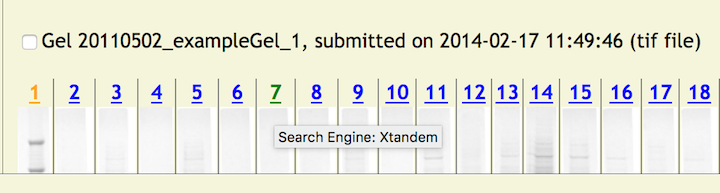
By clicking, on a green link will reveal a pop up window with two portions. One with current information which includes the MS Search Engine and a link to the MS Search Results File. Clicking on this link will display the file in a separate window for viewing or display a standard download dialog box if the file is not viewable in the browser. In addition, a panel for updating the existing data (more on this later) is also displayed.
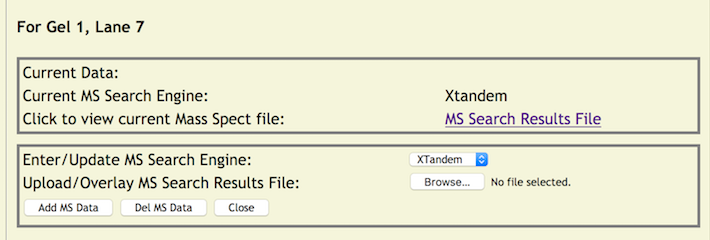
As always, clicking the [CLOSE] button will close the window without further processing.
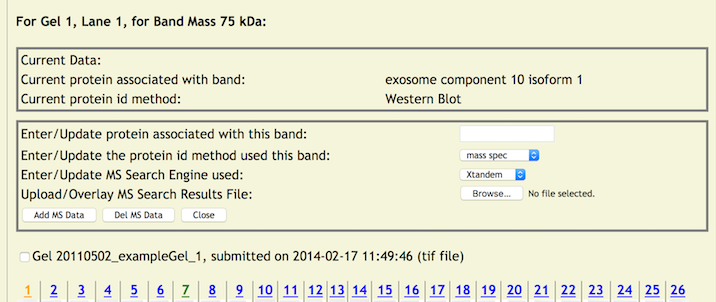
To Add Data to A Band
Clicking on a band (the cursor becomes a cross hair when over a band) will display a pop up window for entering Mass Spec data for that band.
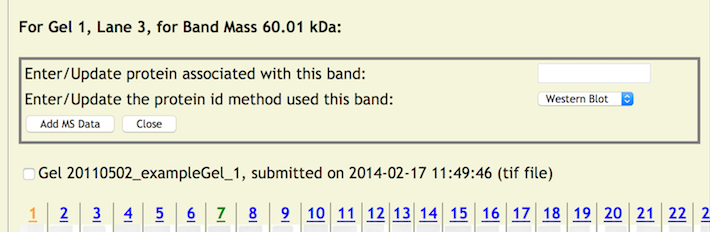
Initially, a simple entry panel is displayed that allows the entry of the protein systematic name to be applied to the band and a pulldown menu for selecting the method used to identify the protein. There are three choices at this time - 'western blot', 'mass spec', and 'other'. If 'western blot' or 'other' is chosen no other data needs to be entered. Clicking on the [Add MS Data] button initiates the update process. The protein systematic name will be verified against local and external databases supported by copurification.org. If a protein ID method of Mass Spec is chosen, then an additional set of entry fields for entering a MS Search Engine and Results File is displayed (the same as in the lane update).
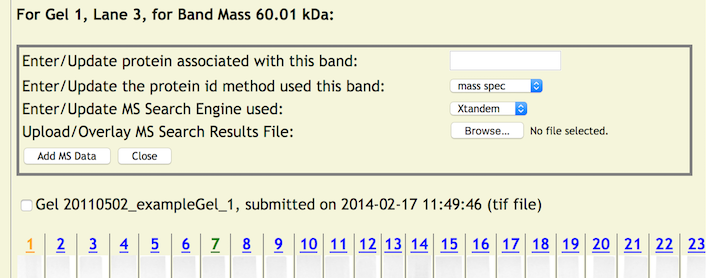
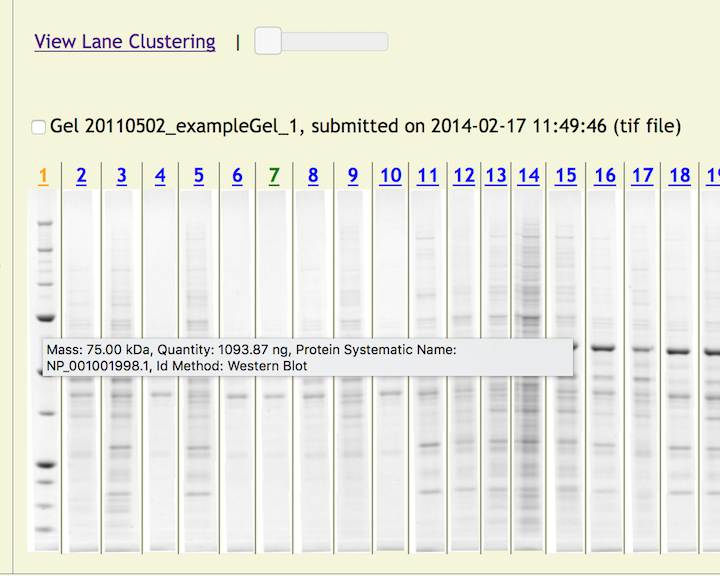
Just as in the lane data entry, first choose one of the search engines from the pull down menu. Next, click the file browse button to choose a MS data file from your server or local machine to upload to the copurification.org web site. By clicking on the [Add MS Data] button, the protein name is verified, the file name is edited and verified. When all fields are edited – three of the data fields are applied to the band in the database and the MS Results File is uploaded. Once completed the page returns to its initial view. However, the color of lane number will change to orange (from either green or blue) indicating that lane has at least one band with information applied to it (note – it is possible that there is lane information applied as well). When the mouse is rolled over the updated band will reveal some updated information – Mass, Quantity, Protein Systematic Name, ID Method.
By clicking on a updated band, a pop up window with two portions will be displayed. One with current information and a panel for updating the existing data (more on this later). It will show at least a protein systematic name and protein id method. If mass spectrometry data was added them the MS Search Engine and Results File (with a link to the uploaded file) will be displayed just as in the lane update. As always, clicking [CLOSE] will close the window without further processing.
Updating and Deleting Lane and Band Mass Spectrometry Data
Existing lane and band mass spectrometry data may be updated at any time. By clicking on either the lane number link or on a band, an update popup panel will be displayed which will allow you to change the protein assigned.
For a lane, either the MS Search Engine, the MS Search Results File, or both may be changed. Note - you must populate both data fields even if only one of them need to be changed. Clicking the [Add MS Data] button will update the data and the web page returns to its initial state. When you do update the MS Results File, the old file is deleted. As always, clicking [CLOSE] will close the window without further processing.
For updating a band, simply click on a band with existing data. The update popup panel will be displayed with existing data and the update panel.
The update panel is completely blank and all relevant data must be reentered even if it is a field that has not changed. With band data, there are additional data that may be added and therefore changed. When the protein ID method is set to either 'western blot' or 'other' only a protein systematic name may be entered. When the protein ID method is set to 'mass spec', an additional update fields are displayed that allows the entry of the MS Search Engine and MS Search Results File. Again, all these fields are empty and all four must be entered when updating the protein information.
In the case when the existing protein ID method is changed from 'western blot' or 'other' to 'mass spec' or visa versa, additional changes may be made behind the scenes upon update. For example, when changing from 'mass spect' to either 'western blot' or 'other', the current MS Search Engine will be nulled in the database and the MS Search Results File will be deleted.
Clicking the [Add MS Data] button will update the data and the web page returns to its initial state. As in the lane update, when you do update the MS Results File, the old file is deleted and the new file is uploaded.
To delete existing data all together, simply click on the [Del MS Data] button and all associated data and files are removed. As always, clicking [CLOSE] will close the panel without further processing.
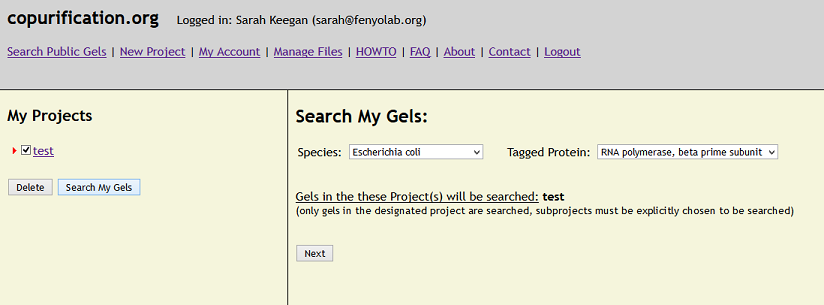
HOWTO - Query Data in the System
To query your data (public and private), use the 'Search My Gels' button below the Projects listing in the left pane once logged in to the site.
Use the checkboxes to choose the Projects/Experiments to include in the Query.
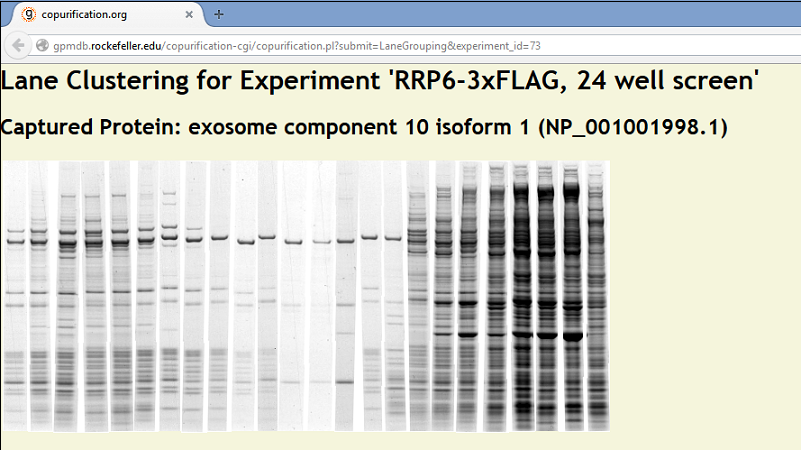
HOWTO - Lane Clustering.
When logged in to the system and viewing an Experiment, click on the link "View Lane Clustering." This will open a new page in the web browser with the lanes for each captured protein clustered by matching bands.
Hovering the mouse pointer over each image will open a tooltip listing the Reagents for a lane.
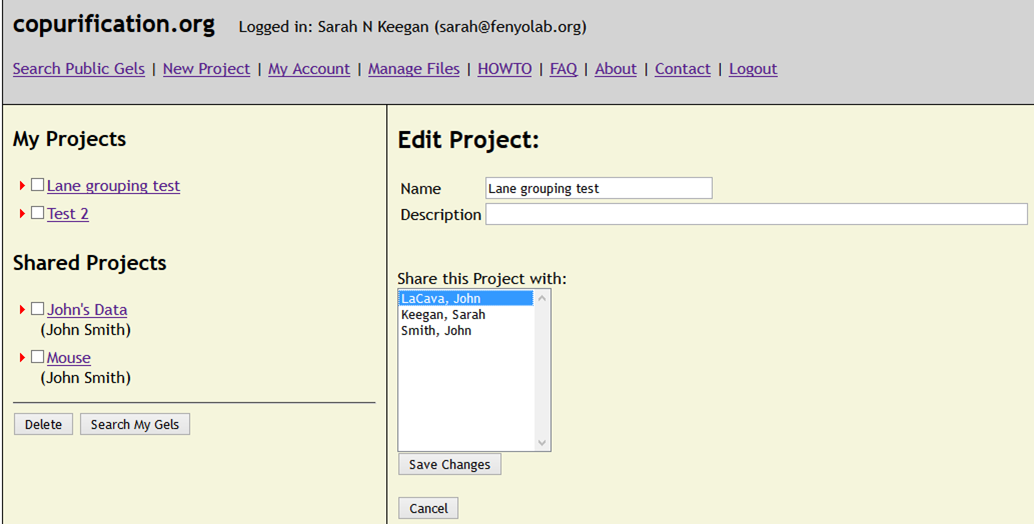
HOWTO - Share Projects/View a Shared Project.
Open an existing Project by clicking on the Project Name in the left hand side tree view. You will see the Project information displayed
in the top area of the main viewing pane. Click on the Edit button and a form will be displayed allowing you to Share the Project with one
or more users. (hold down Ctrl to select multiple users) Then click Save. These users can now view the Project and the Experiments it contains.
Shared Projects can be included in the "Search My Gels" query by selecting them using the check boxes.
If a user has shared his/her project with you, then these will be listed under a separate section in the left hand side viewing pane,
titled "Shared Projects." The Projects can be viewed but not altered in any way. With the new Mass Spectrometry update, clicking on a
lane or band will show the current data only. The update panel will not be displayed. In addition, the mouse rollover will still function
displaying summary data for a lane or band.